Mel Conway’s astute observation that an organization’s communication structure should be reflected in the software architecture has received plenty of attention over the past years.
Part of that is due to the popularization of microservices, which promises natural team boundaries where each team might be responsible for their own service.
As such, Conway’s Law is an important principle that drives both organizational and technical decisions. At the same time, the organizational and social side of code is largely left to subjective judgments. What if we could guide those decisions with objective data instead? Follow along and see how you can measure Conway’s Law.
Visualize the People Side of Code
As soon as an organization grows beyond a handful of people, social aspects like coordination, communication, and motivation issues increase in importance. Unfortunately these, well, softer aspects of software development are invisible in our code; if you pick up a piece of code from your system there’s no way of telling if it’s been written by a single developer or if that code is a coordination bottleneck for five development teams. That is, we miss an important piece of information: the people side of code.
CodeScene’s behavioral code analysis helps you fill in the blanks. Our starting point is to visualize the operational boundaries of each team:

Visualize the primary team behind each component or microservice based on code contributions.
This way, we get a powerful tool to evaluate how well our architecture aligns with the organization. But where does that data come from? That data comes from one of the most under-utilized data sources in the software industry: version-control. By mining version-control data, we can measure where in the code each author works. And those individual authors can be aggregated into teams so that we can inspect Conway’s Law at work in our own codebases.
The next step: Identify Team-Coupling
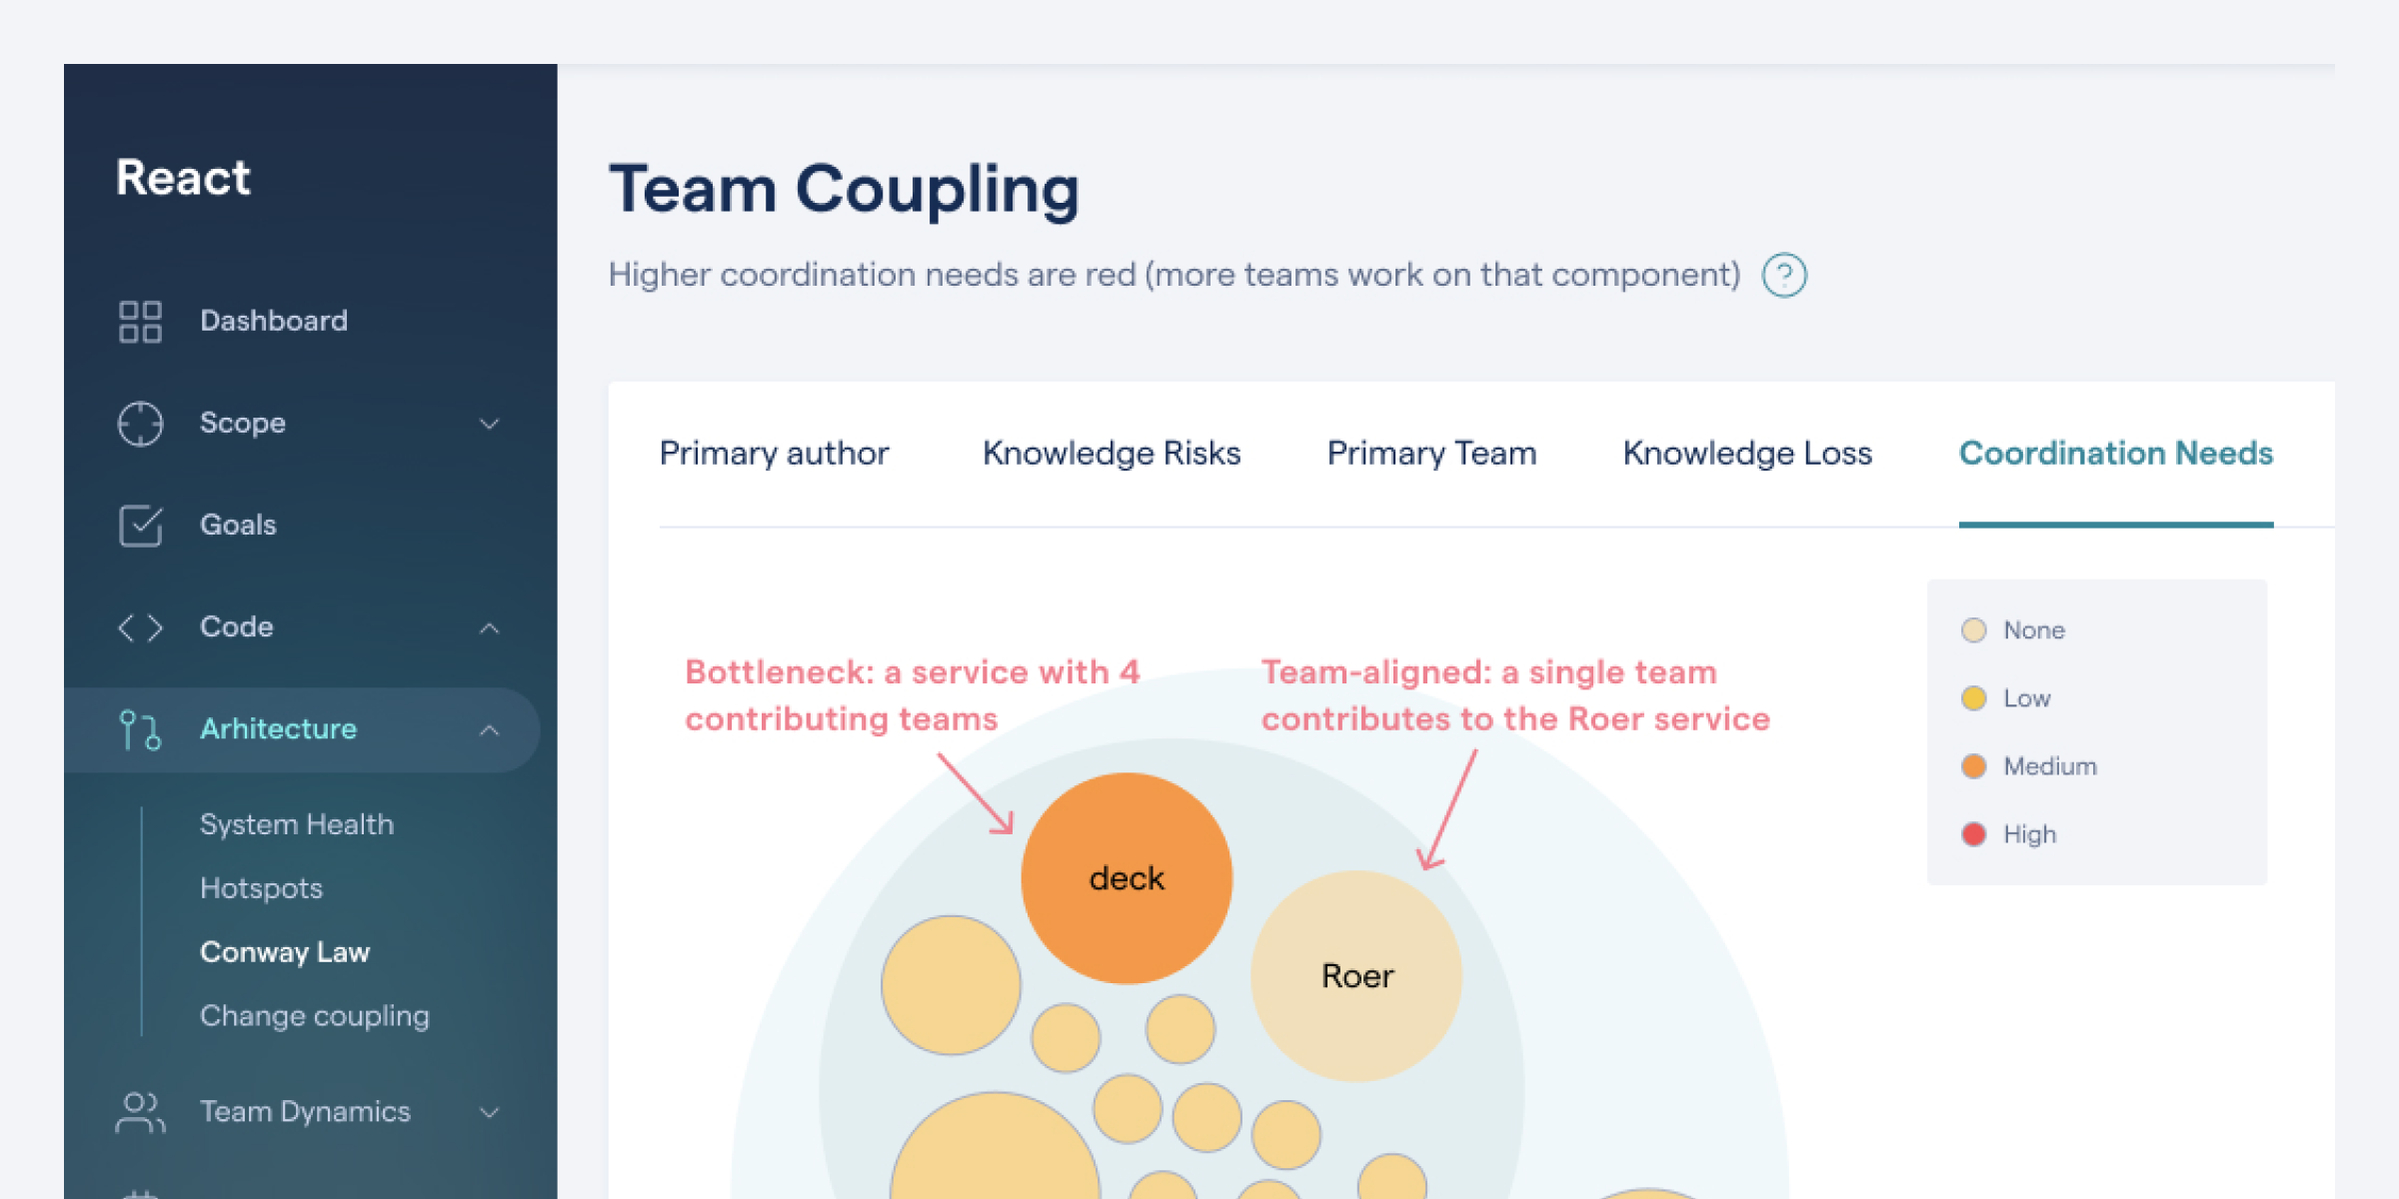
Based on this team data we take the next step and look for overlapping contributions by members of different teams to the same parts of the code. This reveals the sub-systems that become coordination bottlenecks or lack a clear ownership:

Find team coordination bottlenecks based on code contributions: the redder, the more team coupling.
The preceding figure shows several components/services that have recent contributions from different teams. Strong team coupling is a consequence of design issues (too many responsibilities within the same service) or a misalignment between the architecture and the team structure.
As such, behavioral code analysis helps you ask the right questions. You use this information to find parts of the code that may have to be split and modularized to facilitate parallel development by separate teams, or, find opportunities to introduce a new team into your organization to take on a shared responsibility.
There’s More
The way developers collaborate is crucial to the success of any system, and this blog post has really just scratched the surface. If you want to dive deeper, you might want to check out the related topic on how to visualize microservice dependencies in a team context. I’m also covering these use cases with real-world examples Software Design X-Rays: Fix Technical Debt with Behavioral Code Analysis.
Finally, you might want to explore Conway’s Law in your own system. All analyses are fully automated via CodeScene and available for free. Free forever for open source, and a full free trial on closed source.