Part 1: Predict Maintenance Problems in Large Codebases

Welcome to the first part in the Software (r)Evolution series! Software (r)Evolution is a series of articles that explore novel approaches to understanding and improving large-scale codebases. Along the way we’ll use modern data science to uncover both problematic code as well as the behavioral patterns of the developers that build your software. This combination lets you to identify the parts of your system that benefit the most from improvements, detect organizational issues and ensure that the suggested improvements give you a real return on your investment. I’m thrilled, so let’s get started!
How Software Evolution Lets You Understand Large Codebases
Bad code tends to stick. Not only does it stay where it is; It stays there for years often outliving its original programmers, in the organizational sense, and to the displeasure of the next generation of programmers responsible for its maintenance. Making changes to such code is a high risk activity. Given the scale of today’s codebases, we need more efficient tools to identify those parts of the system so that we can apply corrective actions, invest extra testing efforts, or focus code reviews. In this article we use data on our past behavior as software developers to guide such decisions.
The Challenges of Scale
Today’s software systems consists of hundreds of thousands, often million lines of code. The scale of such systems make them virtually impossible to reason about; There are few people in the world who can keep a million lines of code in their head.
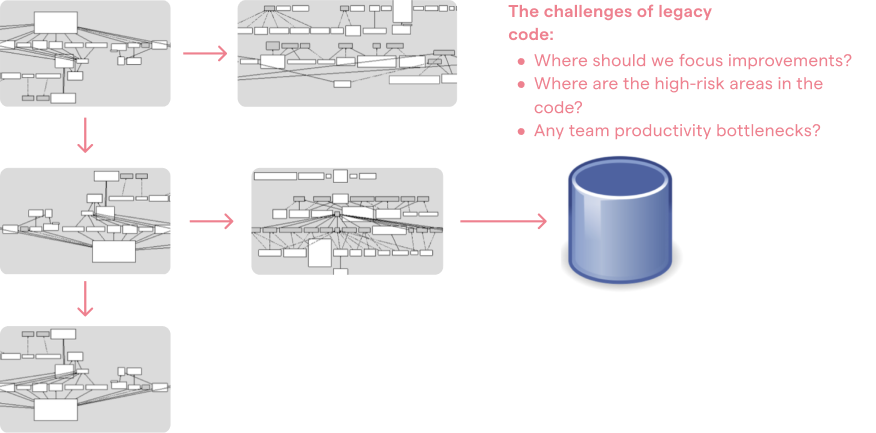
A typical system consists of multiple technologies and complex sub-systems.
Today’s systems are also built on several different technologies. As an example, consider a classic three tier architecture where you use JavaScript on the front-end, implement the services in Java or .Net, and use SQL to access the database. As if this technical variety isn’t complex enough, large-scale systems are also developed by multiple programmers organized into different teams. Each individual programmer is only exposed to a small part of the codebase. That means every programmer has their own view of how the system looks. No one has a holistic picture. Our main challenges, if we want to understand and improve large codebases, is to balance these technical and organizational challenges. That is, any solution we come up with must:
- Gather the collective intelligence of all contributing programmers to identify the parts of the codebase in need of extra attention.
- Present a language-neutral approach to handle polyglot codebases.
- Prioritize the parts of the code that matters the most with respect to productivity and risk amongst million lines of code.
Unfortunately, as evident by sources like the CHAOS report - the majority of all projects fail to deliver on time or on budget - this is where organizations fail. I think there’s a simple explanation for this ceaseless failure of our industry: The reason it’s so hard to prioritize improvements is because most of the time we make our decisions based on what we see: the system as it looks today, it’s code. But I will claim that it’s incomplete information. In particular, there are two key aspects that we lack:
- Time: From the code alone we cannot see how the system evolves and we cannot identify long term trends. There’s no way of separating code that’s stable in terms of development from code that we have to keep changing.
As we’ll see, a time dimension is vital to our ability to prioritize improvements to the code. - Social information: From the code alone we cannot tell if some module is a productivity bottleneck where multiple developers need to coordinate their work. Since communication and coordination needs are driving forces of software costs, we’d need a social dimension in order to make informed decisions around our system. And, perhaps somewhat surprisingly, this social dimension goes beyond management and is just as important for our ability to make sound technical decisions.
Let’s see how we can use software evolution to help us out.
Use Version-Control Systems as Behavioral Data
Data analysis is mainstream now and the rise of machine learning has taught us developers how to find patterns in complex phenomenons. I find it genuinely fascinating that we are yet to turn those techniques on ourselves. We need to close that gap, so that’s what we’ll spend the rest of this article series on. Let’s uncover what happens when we start to study patterns in our own behavior, as programmers, in order to better understand how our systems grow.
The best thing with this approach is that virtually all software organizations already have the data they need - we’re just not used to think about it that way - in their version-control systems. A version-control system is basically a behavioral log of how each developer has interacted with the code. Not only does version-control data record when and where a code change was made; Version-control data also records social information in terms of who made that change. So let’s put version-control data to use on a large system.

Towards an Evolutionary View of Software
As part of my day job at Empear, I’ve analyzed hundreds of different codebases. There are some patterns that I see recur over and over again, independent of programming languages and technology. Uncovering these patterns help us understand large codebases.

Have a look at the three graphs in the illustration above. All graphs show the same thing. The X-axis shows each file in the system sorted on their change frequencies (the number of commits as recorded in the version-control data). The Y-axis shows the number of commits for each file.
The graphs above show the data from three radically different systems. Systems from different domains, codebases of different size, developed by different organizations and of different age. Yet all graphs show the same power law distribution.
The distributions above show that most of our development activity is located in a relatively small part of the total codebase. The majority of all files are in the long tail, which means they represent code that’s rarely, if ever, touched.
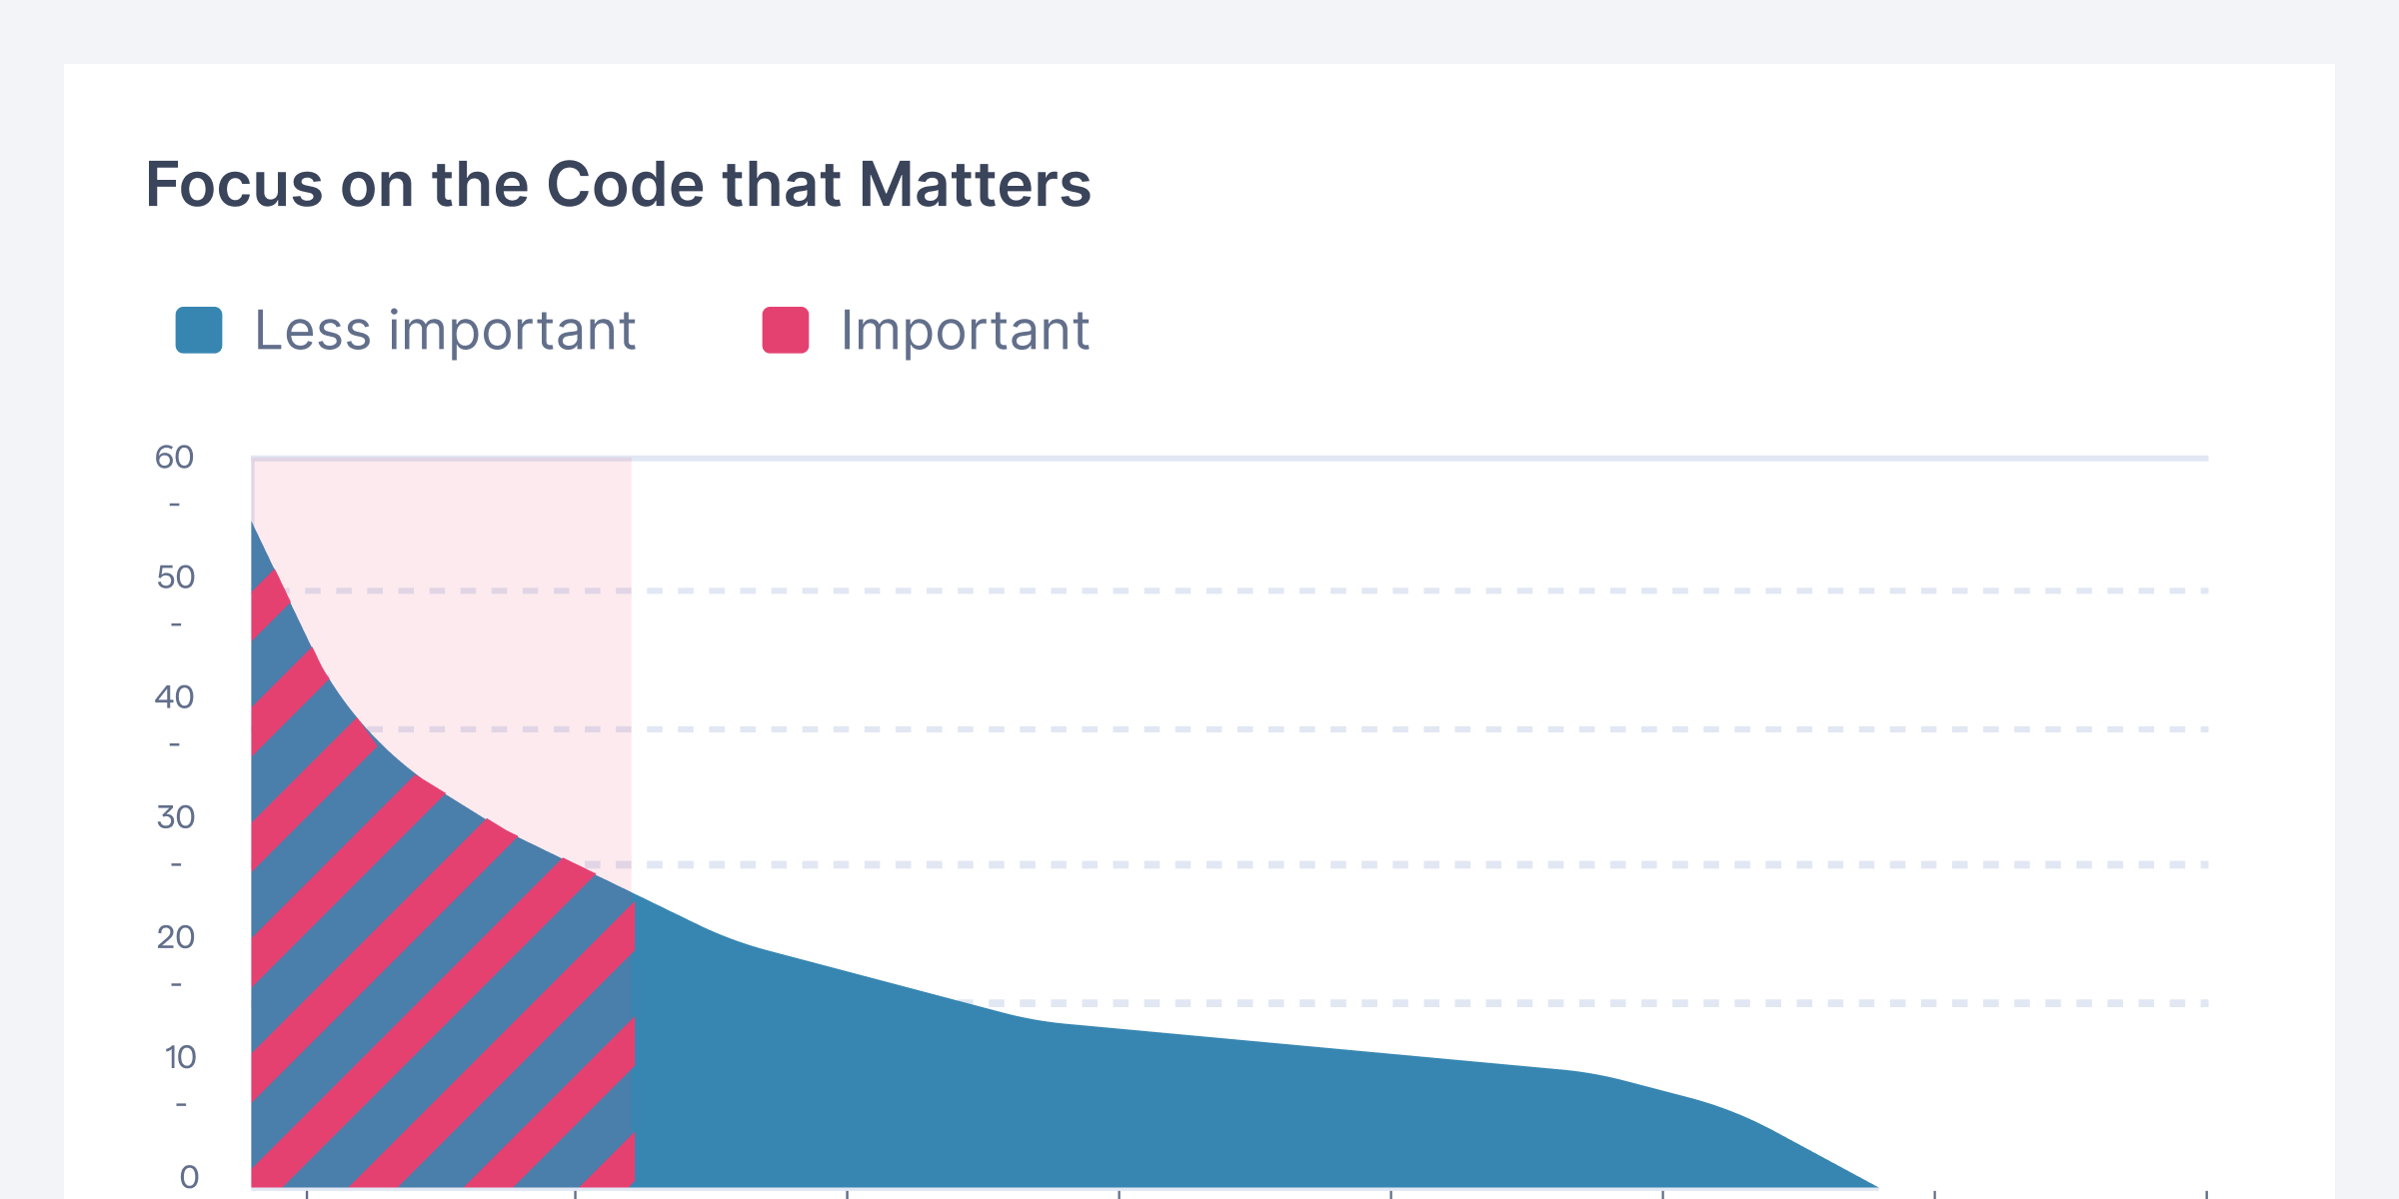
This change distribution of code has several interesting implications. First of all, it gives us a tool to prioritize improvements and refactorings. Refactoring complex code is both a high-risk activity and expensive. Using our knowledge of how code evolves, we’re able to focus on the parts where we’re likely to get a return on that investment. That is, the parts where we spend most of our development efforts as shown in the following illustration.
Focus on the Code that Matters

Any improvements we make to the files in the red area (highlighted in the illustration) have a high likelihood of providing productivity gains since those files represent code we need to work with all the time. It’s also important to identify files with high change frequencies from a quality perspective. The reason is that a high change frequency is correlated to frequent maintenance problems. In fact, the importance of change to a module is so high that more elaborate metrics rarely provide any further predictive value when it comes to fault prediction.
However, despite these findings, our model still suffers a weakness. Why, because all code isn’t equal. For example, it’s a huge difference to increase a simple version number in a single-line file compared to correcting a bug in a file with 5.000 lines of C++ with tricky, nested conditional logic. The first change is low risk and can for all practical purposes be ignored while the second type of change needs extra attention in terms of test and code inspections. Thus, we need to add a second dimension to our model in order to improve its predictive power; We need to add a complexity dimension. Let’s see how that’s done.
A language-neutral complexity metric
There have been several attempts at measuring software complexity. The most well-known approaches are McCabe Cyclomatic Complexity or Halstead complexity measures. The major drawback of these metrics is that they are language specific. That is, we need one implementation for each of the programming languages that we use to build our system. This is at conflict with our goal of providing language-neutral metrics to get a holistic overview of modern polyglot codebases.
Fortunately, there’s a much simpler metric that performs well enough: the number of lines of code. Yes, sure, the number of lines of code is a rough metric, yet it has just as good predictive power as more elaborate metrics like cyclomatic complexity. The advantage of using lines of code lies in the simplicity of the metric; Lines of code is both language neutral and intuitive to reason about. So let’s use lines of code as a proxy for complexity and combine it with a measure of change frequency to identify Hotspots in our codebase.
Identify high risk changes with Hotspots

A hotspot is complicated code that you have to work with often. Hotspots are calculated from two different data sources:
- We use the lines of code as a simple proxy for complexity.
- We calculate the change frequency of each file by mining their version-control history.
CodeScene for software analysis provides its Hotspot analysis as an interactive map that lets you explore your whole codebase interactively. In the following visualizations, each file is represented as a circle as described above:
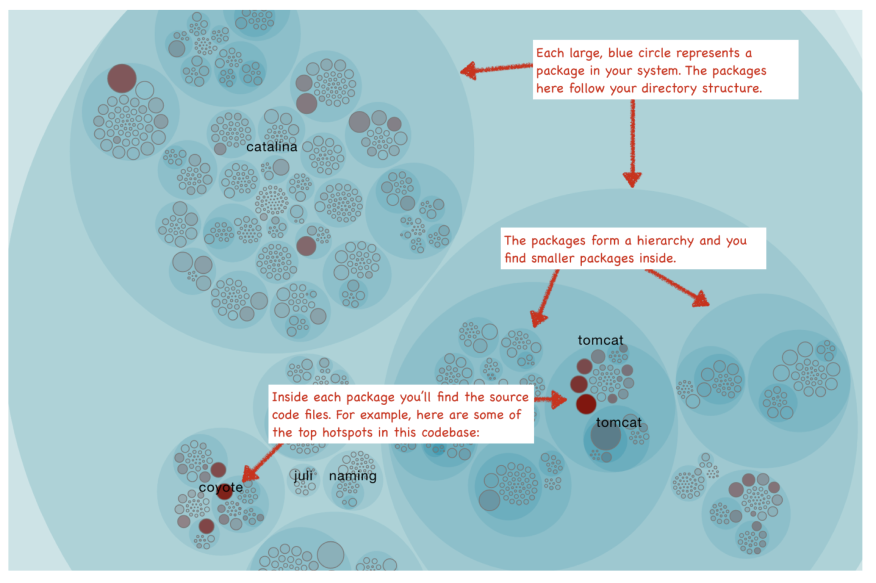
The Hotspots map lets you view each Hotspot in the context of your system. The visualization also lets you identify clusters of Hotspots that indicate problematic sub-systems. Of course there’s more to a true Hotspot than a high change-frequency. We’ll explore those aspects in a minute, but let’s first walk through some use cases.
Know how to use Hotspots
A Hotspots analysis has several use cases and serves multiple audiences:
- Developers use hotspots to identify maintenance problems. Complicated code that we have to work with often is no fun. The hotspots give you information on where those parts are. Use that information to prioritize re-designs.
- Technical leaders use hotspots for risk management. Making a change to a Hotspot or extending its functionality with new features is high risk. A Hotspot analysis lets you identify those areas up-front so that you can schedule additional time or allocate extra testing efforts.
- Hotspots point to code review candidates. Code reviews are powerful in terms of defect removal, but they’re also an expensive and manual process so we want to make sure each review represents time that is well invested (code review fatigue is a real thing). In this case, use the hotspots map to identify your code review candidates.
- Hotspots are input to exploratory tests. A Hotspot Map is an excellent way for a skilled tester to identify parts of the codebase that seem unstable with lots of development activity. Use that information to select your starting points and focus areas for exploratory tests.
Dig deeper with complexity trends and machine learning
Once we’ve identified our top Hotspots we need to understand how they evolve; Do we already know about the Hotspot in the sense that we’ve started to improve the code and make future changes less risky? Are they Hotspots because they get more and more complicated over time or is it more a question of minor changes to a stable code structure?
To answer those questions, we need to look at the trend over time as illustrated in the following picture.

The picture above shows the complexity trend of single hotspot, starting in mid 2014 and showing its evolution over the next year and a half. It paints a worrisome picture since the complexity has started to grow rapidly. Worse, the complexity grows non-linear to the amount of new code, which indicates that the code in the hotspot gets harder and harder to understand. As a bonus, you also see that the accumulation of complexity isn’t followed by any increase in descriptive comments. This looks more and more like a true maintenance problem.
If you payed close attention, you’ve probably noted that the complexity trend metric differentiates between lines of code and complexity. While lines of code serves well as a heuristic on a Hotspot map, the metric is too rough when it comes to certain long-term trends. For example, we want to differentiate between a file that just grows in pure size from the case where each line of code becomes harder to understand (often due to liberal use of conditional logic). Both cases have their own set of problems, but the second case implicates higher risk. That means we need to be more language aware when calculating trends.
Multi-Dimensional Hotspots
Alright, I hinted earlier that true Hotspots are about more than just high change frequencies. For example, we’d like to consider the complexity trend as part of the Hotspot criteria. CodeScene does that. In addition, CodeScene employs a machine learning algorithm that look at deeper change patterns in the analysis data, like development fragmentation that indicates coordination problems on an organizational level and coupling to other entities. The rationale is that complicated code that changes often is more of a problem if:
- The hotspot has to be changed together with several other modules.
- The hotspot affects many different developers on different teams.
Since CodeScene incorporates organizational information like team structures we’re able to detect code that’s truly expensive to maintain. Each time a change pattern in your codebase crosses an organizational boundary you’ll pay a price in terms of coordination and communication overhead.
The following illustration shows how this algorithm manages to narrow down the amount of Hotspots to a small part of the total code size when run on a number of open source projects:
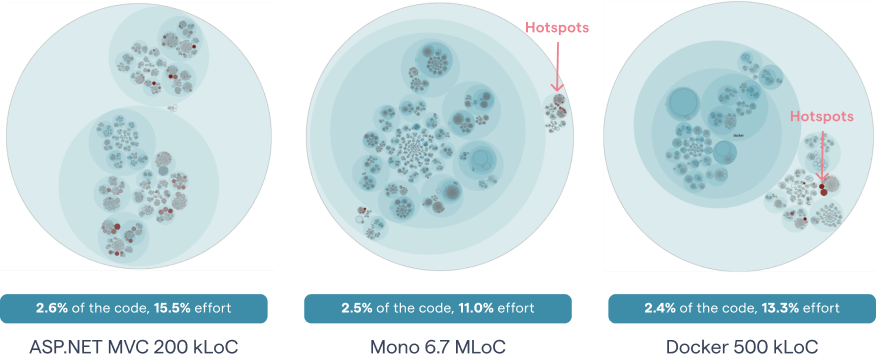
As you see in the picture above, the prioritized Hotspots only make up 2-3% of the total code size. Yet there’s a disproportional amount of development activity in that small part with 11-16% of all commits touching those Hotspots. This means any code improvement to a prioritized Hotspot is time well-invested.
Hotspots identify defect dense parts
As we launched CodeScene we spent a lot of time validating and testing the analyses on real-world codebases. One thing I did was to investigate how well the identified Hotspots predict defects. This was done by identifying where in the code corrective actions were performed. We then re-winded the version-control history, measured the Hotspots and looked for a correlation.
Our results shows a strong correlation between the top Hotspots and the most defect dense parts in the code. In general, the top Hotspots only make up a minor part of the code, yet that code is responsible for 25-70% of all reported and resolved defects.
My book Your Code as a Crime Scene dives deeper into some of the research findings we used as a starting point when developing CodeScene Enterprise Edition, as well as to why and how Hotspots work. But let’s just summarize the conclusions in one line: There’s a strong correlation between Hotspots, maintenance costs and software defects. Hotspots are an excellent starting point if you want to find your productivity bottlenecks in code and with CodeScene Enterprise Edition that knowledge is more accessible than ever.
Cover image original: https://de.wikipedia.org/wiki/Republikanischer_Club